Being one of the largest energy suppliers in the world, bp has direct access to market-leading set of first-party transactional data on Fleet vehicles through their fuel card program. I led the launch of a pilot that leveraged this data through a TCO (Total Cost of Ownership) portal.
What shipped
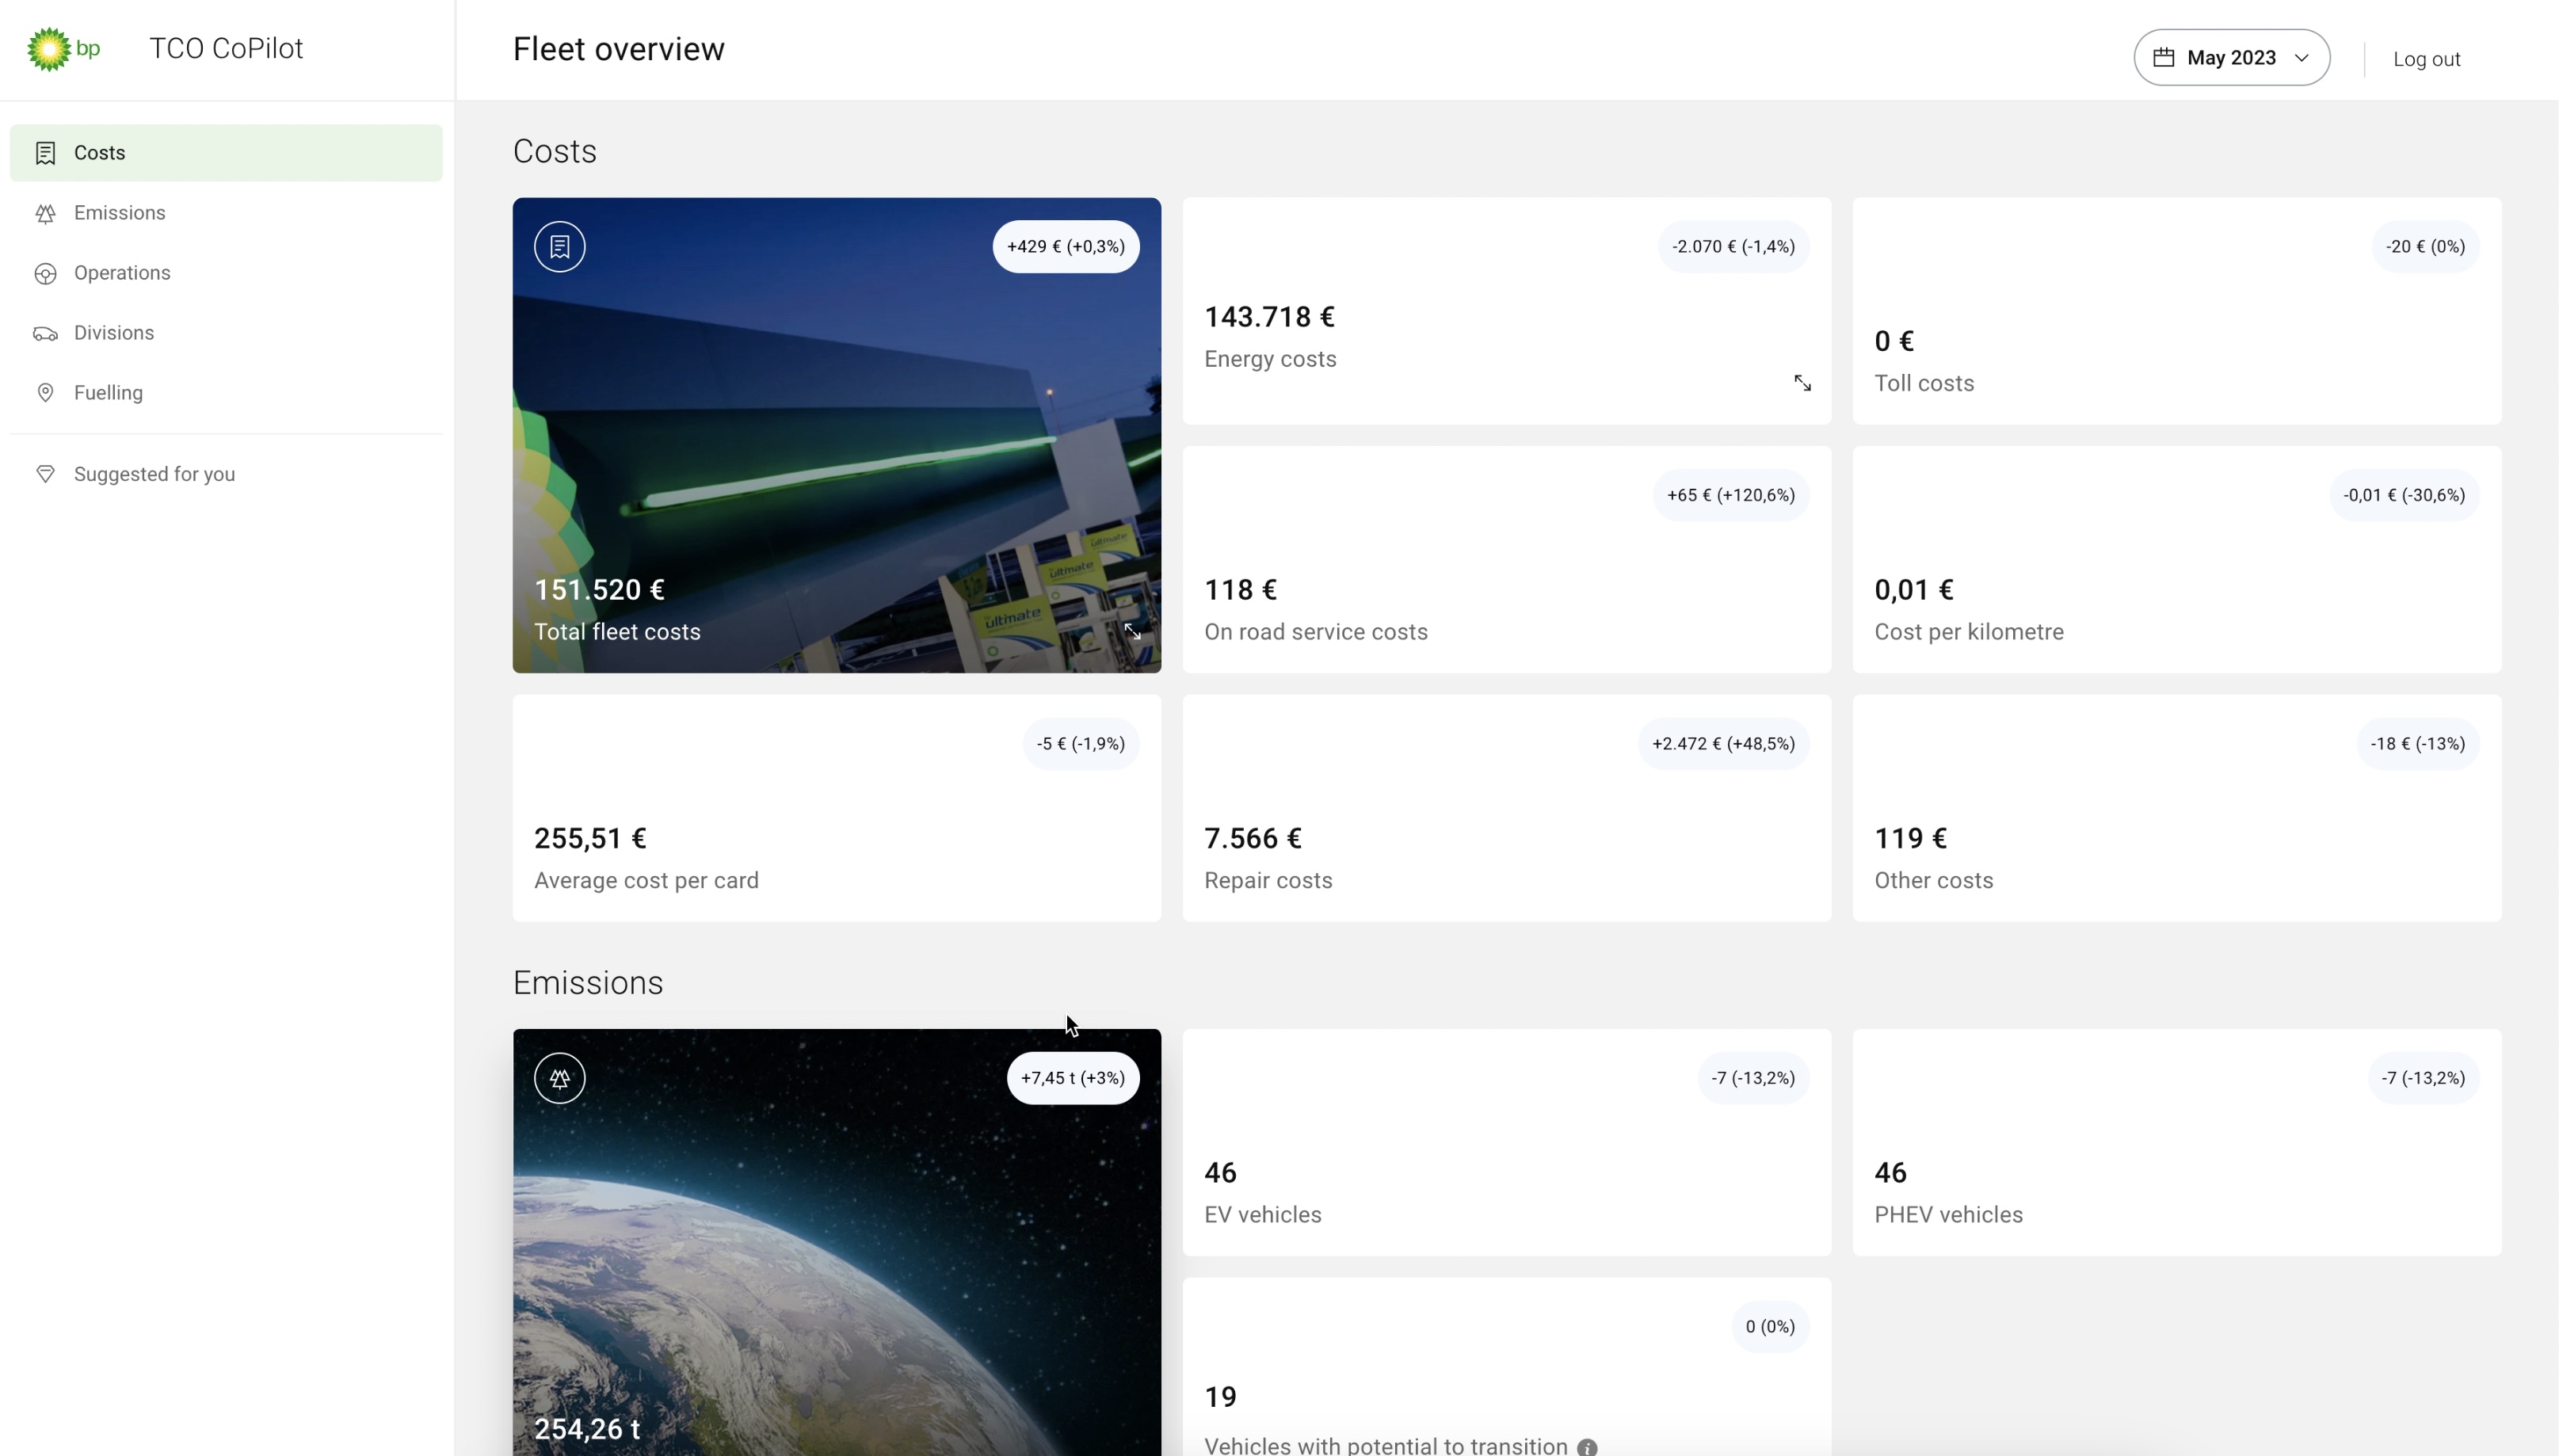
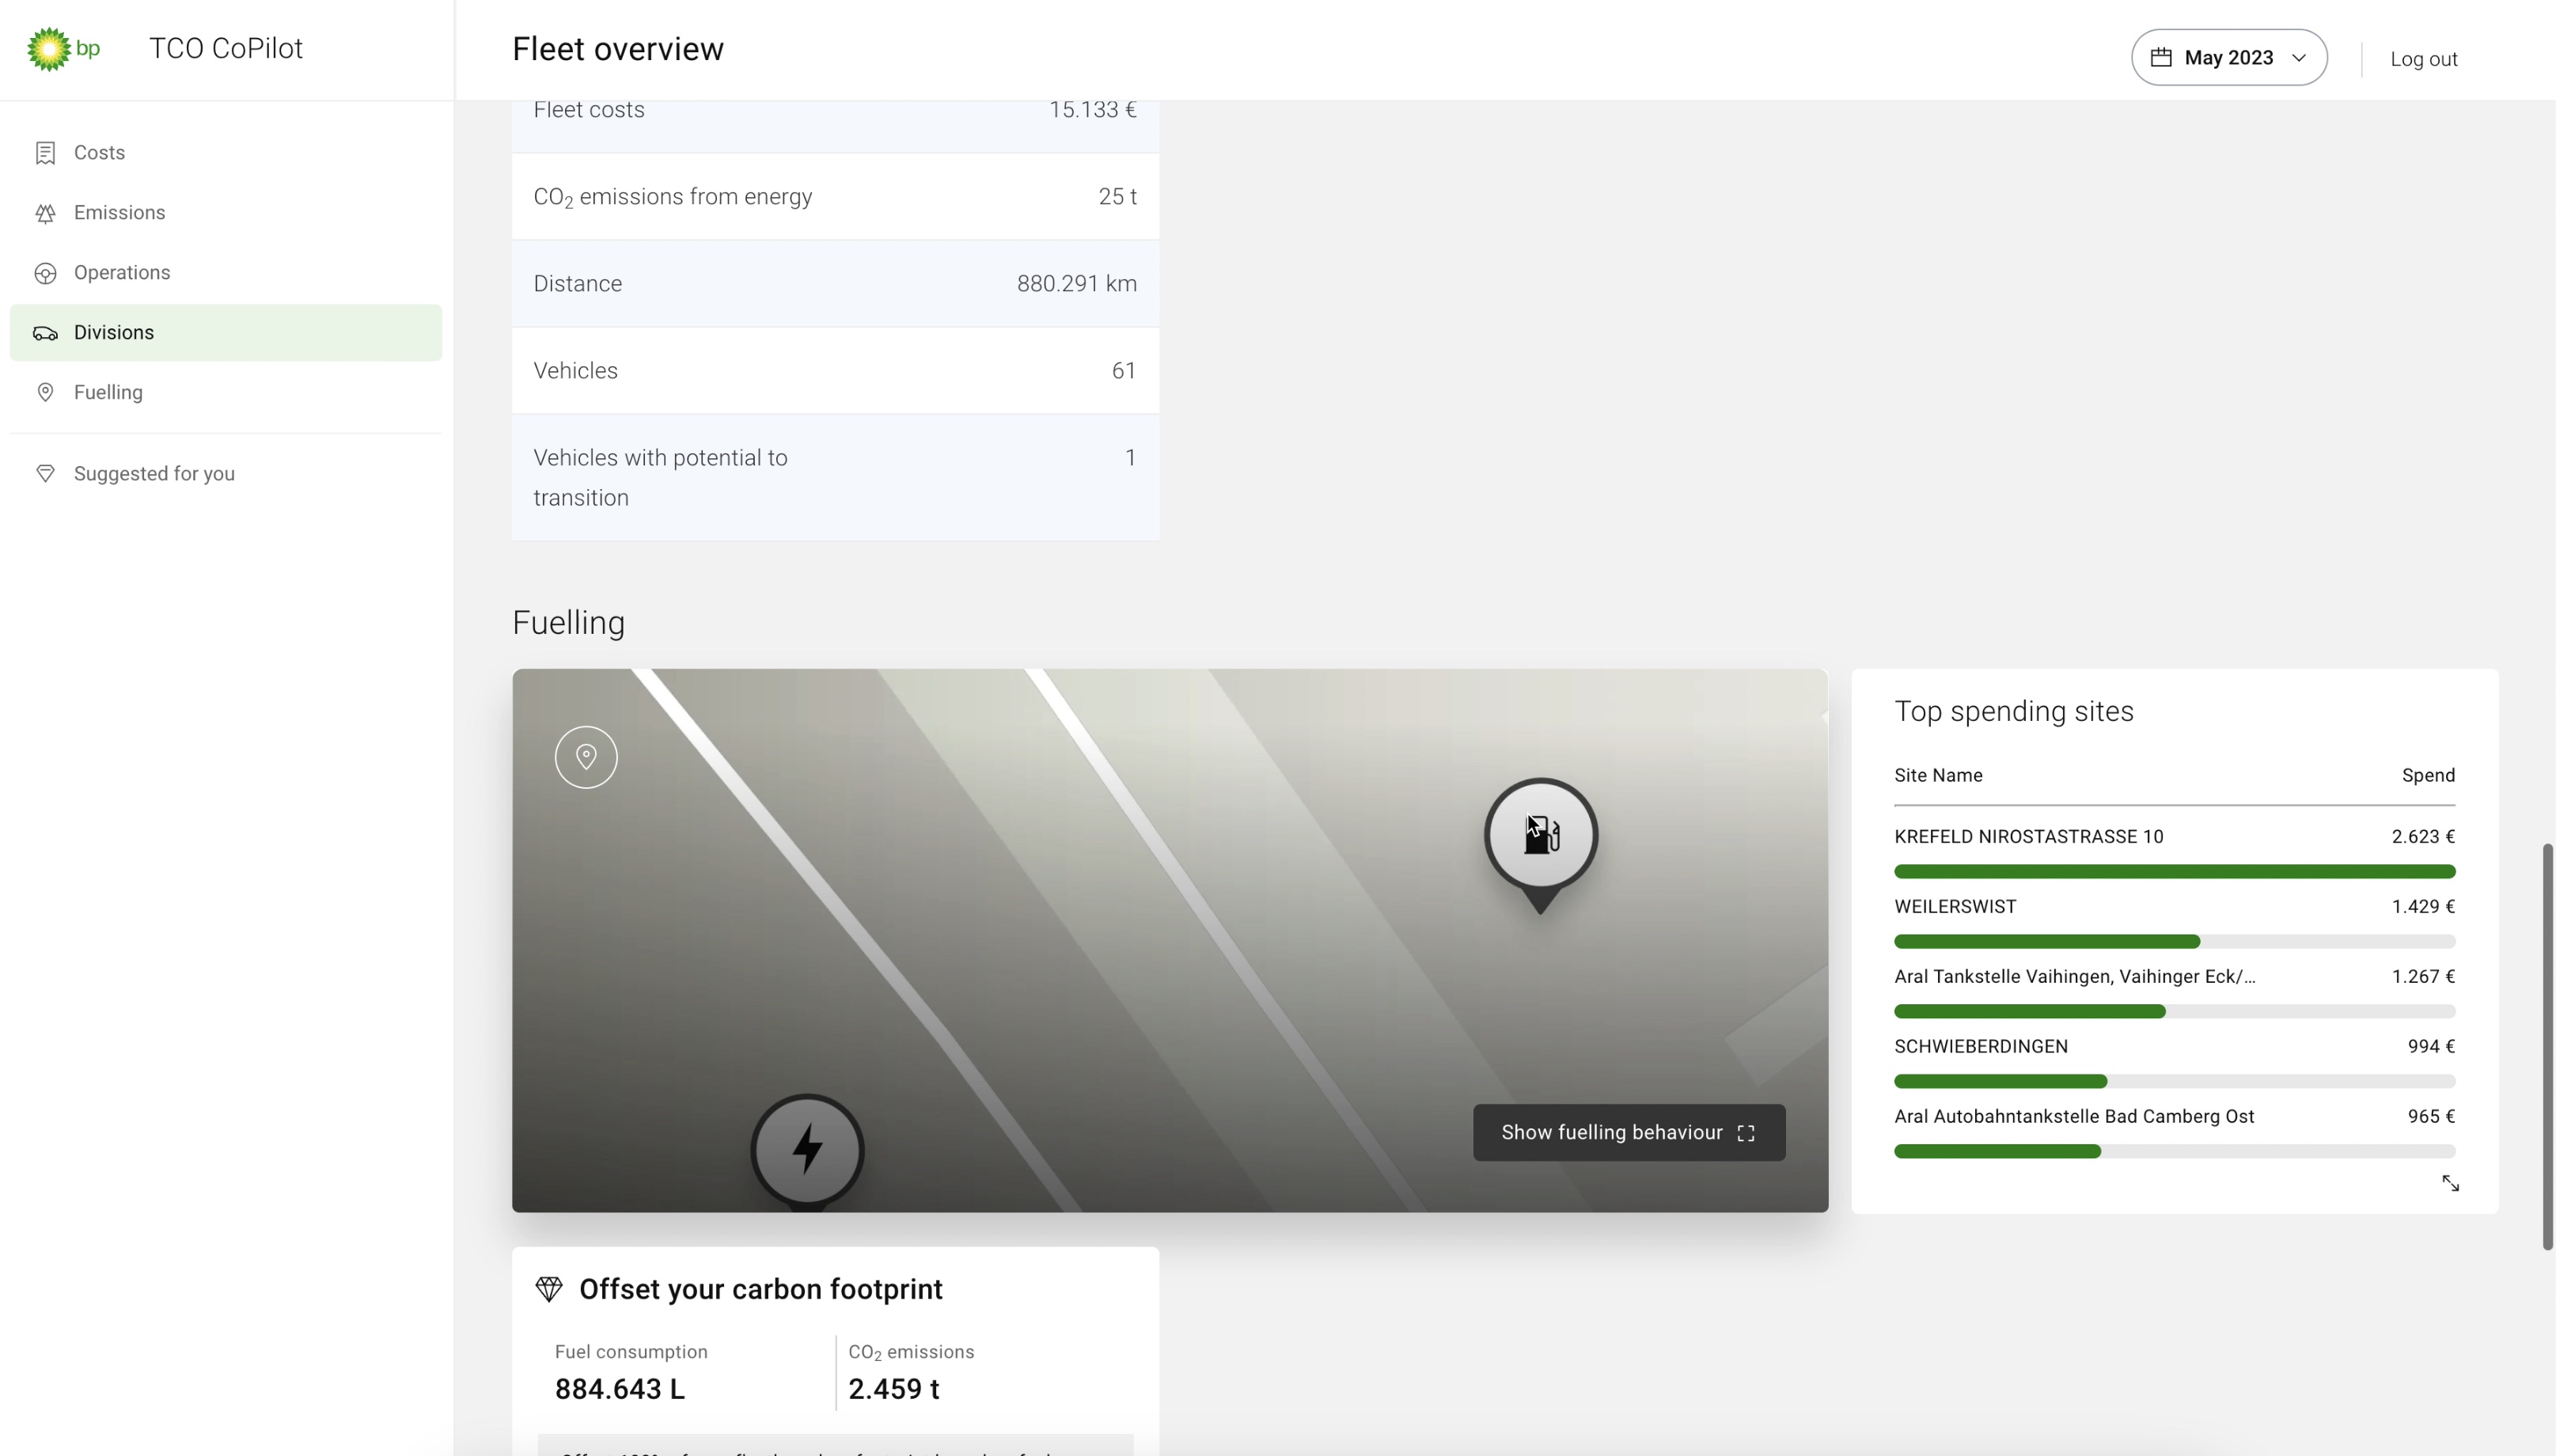
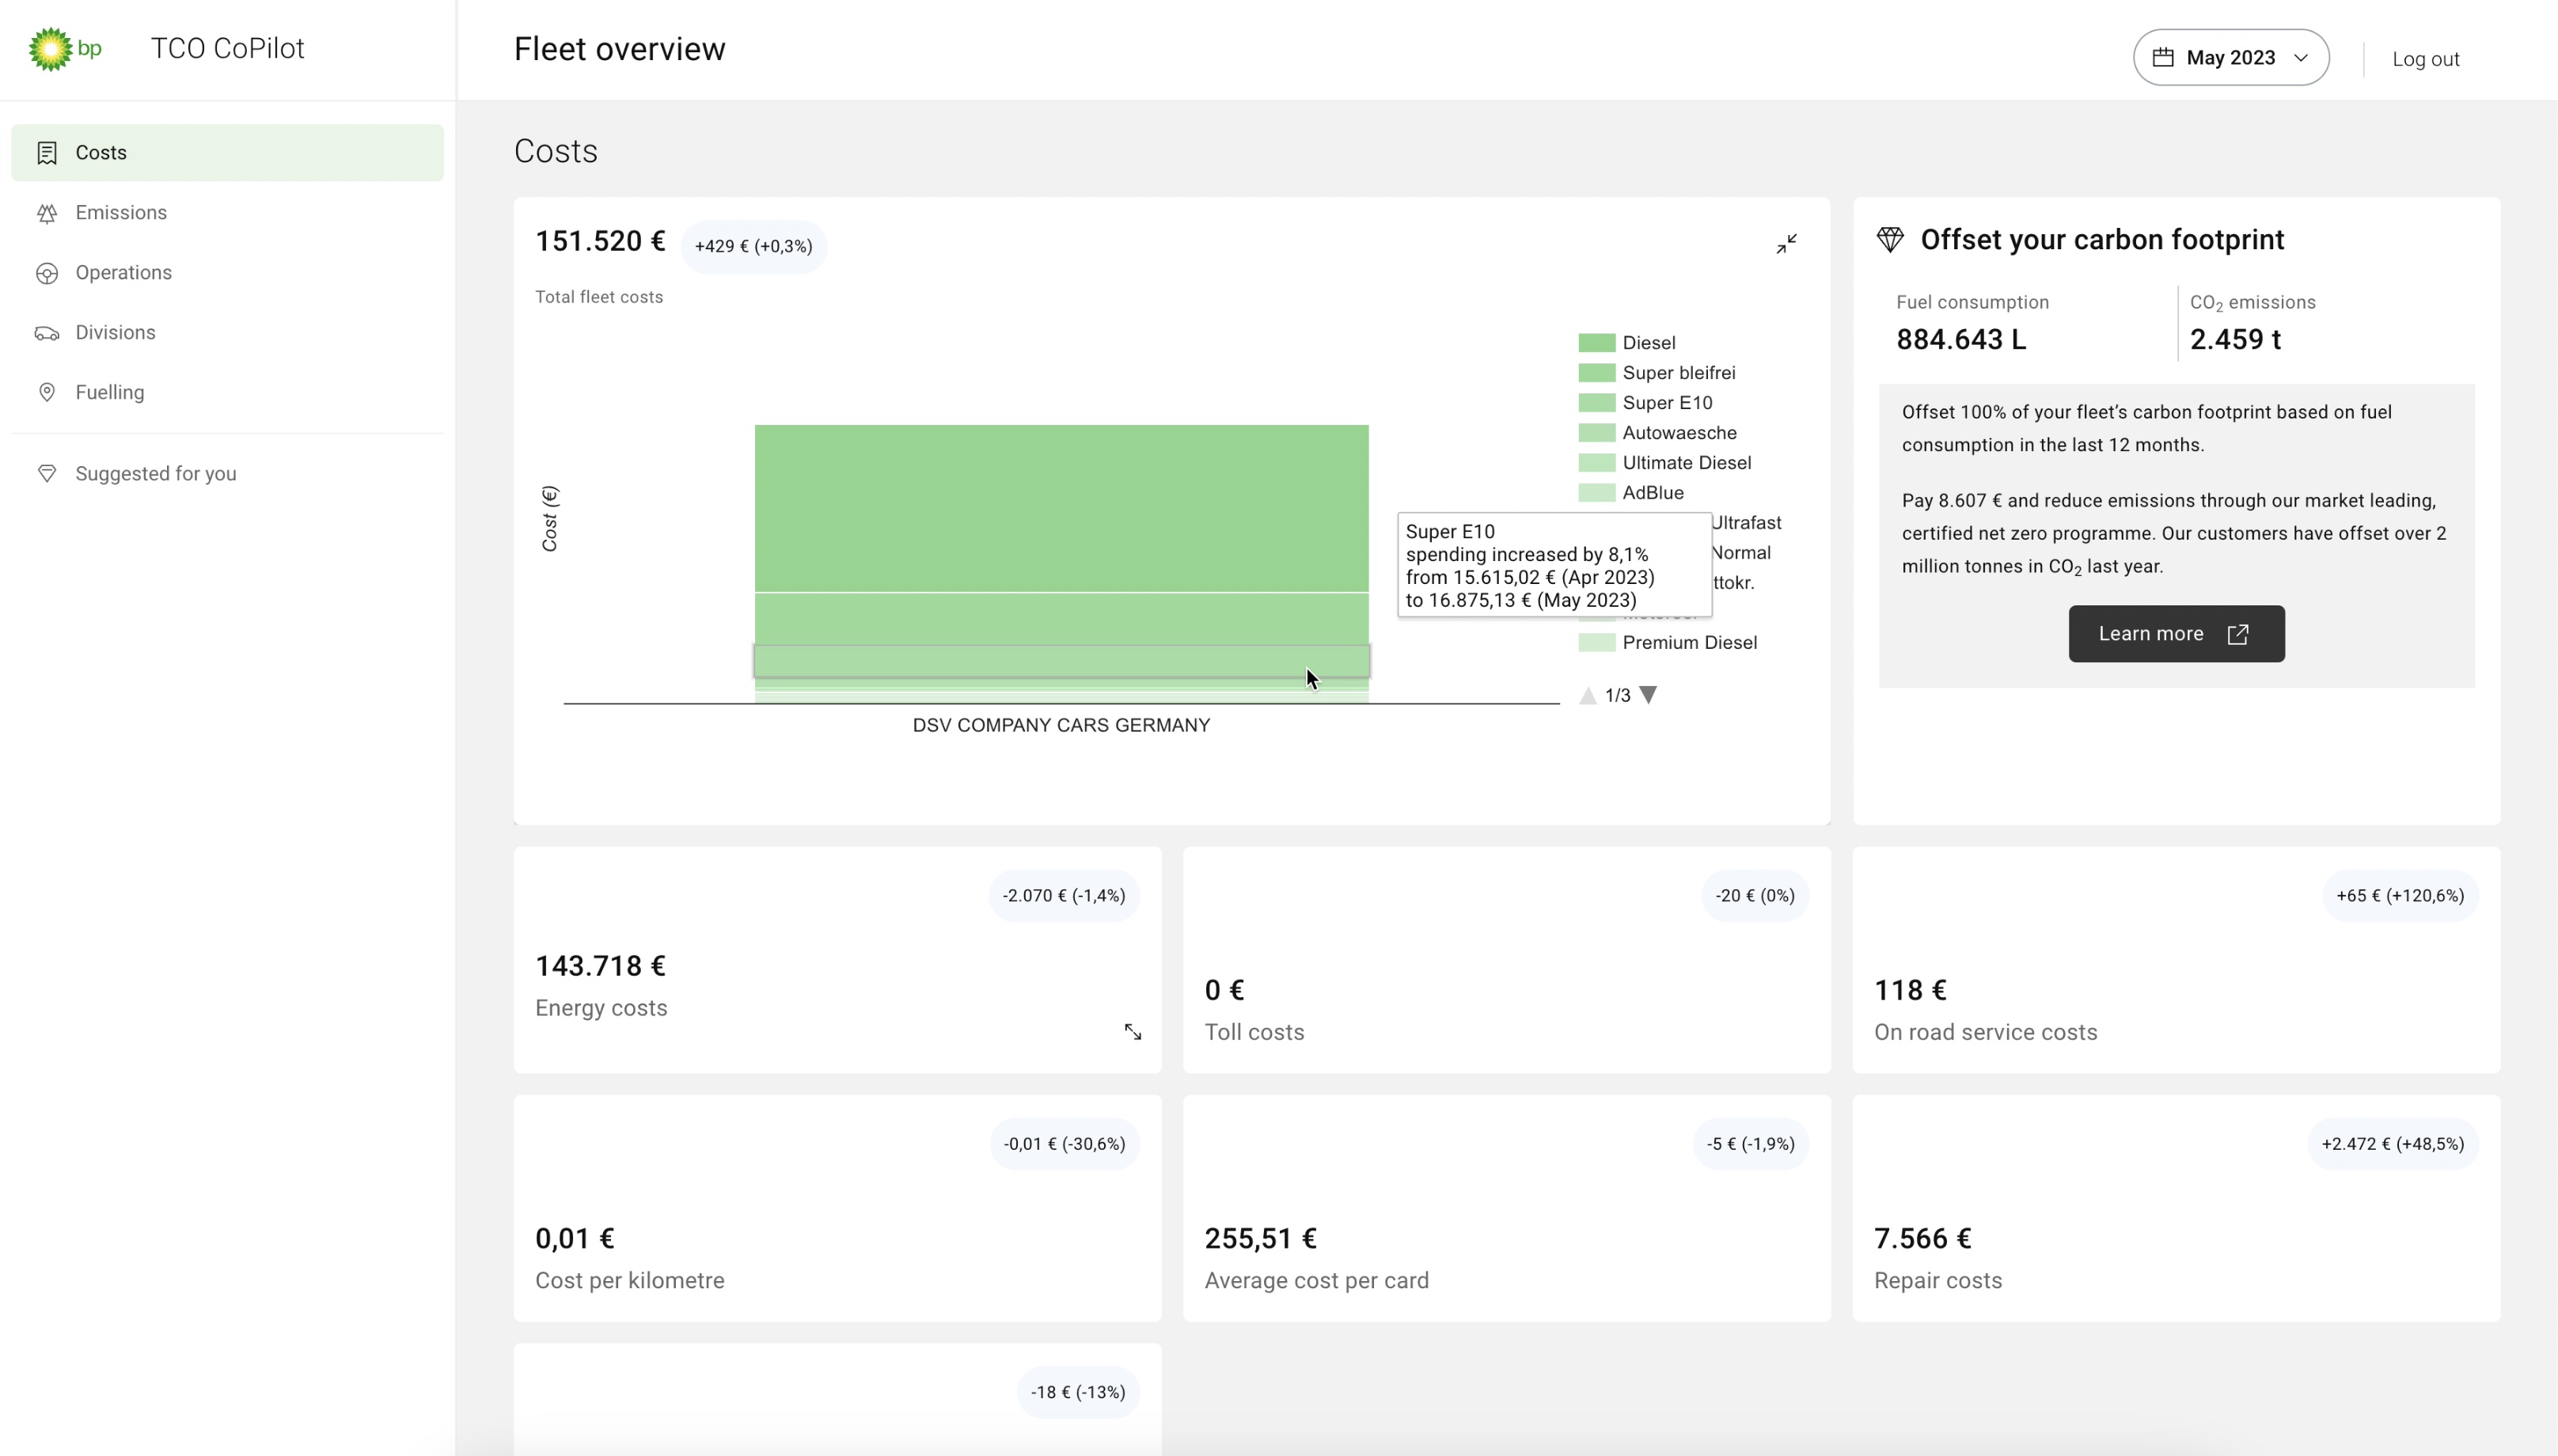
- Public pilot of a Fleet TCO dashboard for enterprise operators
- Data ingestion + normalization for 10M+ fuel-card transactions (multi-market)
- Cost/efficiency views (vehicle, route, site, driver behaviour), CO₂e estimates, anomaly flags
- Row-level security / tenant isolation, export & “share” flows for stakeholders
Impact
- Decision-ready in minutes instead of manual CSV merges and ad-hoc spreadsheets
- Surfaced high-leak areas (outlier sites/prices, low-MPG vehicles, misuse patterns) with clear next actions
- Made CO₂e and cost visible together, enabling trade-off conversations with Ops & Finance
- Created a repeatable data model and governance patterns for other Fleet analytics use-cases
- Established a v2 path (from pilot to productized experience) without throw-away work
My role & scope
- Led end-to-end technical delivery: ingestion → modeling → security → dashboards
- Defined the domain model (transactions → vehicles/routes/sites) and aggregation strategies
- Set up observability & data quality checks (schema drift, null spikes, reconciliation)
- Collaborated with data scientists and data engineers when adopting algorithms for large-scale analysis and ingestion
- Partnered with Product/SMEs to prioritise answerable questions and measurable outcomes
Key decisions & trade-offs
- PowerBI / AWS QuickSight vs custom-built React front-end
- PowerBI and QuickSight provides many of the metric and chart views needed for MVP and quickly
- React allows for better branding, layout and responsiveness with richer tailored data for specific use-cases
- PowerBI and QuickSight knowledge was very limited on the team and did not support our data sources out-the-box, creating extra barriers to move fast
- React FE + embedded QuickSights gave us a mix of both to achieve the fastest outcomes in all areas
- Databricks vs AWS-native tooling
- Databricks provides the all-in-one data platform needed to perform much of the ETL capabilities but was not part of the native stack at bp
- We selected AWS-native stack including RedShift, Glue, Lambda, Step Functions, S3, Athena
- Allowed the data engineering team to move faster with lower provisioning times and deploy to bp's landing zone quickly and cost effectively
Stack (pilot)
- AWS (S3, Glue Data Catalog, Athena/Redshift Serverless)
- React, react-charts, AWS QuickSights (embedded)
- Python/Node for ingestion
- AWS CDK with TypeScript for infra
See it in action